
2026 Boulder Budget – Staffing
Since the pandemic staffing levels have risen significantly.
Staffing Levels
Between 2019 and 2025 the city of Boulder increased staffing by 191 Full Time Equivalent (FTE) employees. Graph 1 shows 1426 FTE in 2019 and 1539 FTE in 2023 for a net increase of 113 FTE.
In 2024 the Library was spun off reducing staff by 78 FTE. Those positions were distributed to other departments and by 2025 the workforce was once again at 1539.
Even though 2026 is an austerity budget, overall staffing rises to 1548 with the addition of city council members as full time employees.
The total increase from 2019 to 2026 is 200 FTE. This representing a 14% increase in headcount.
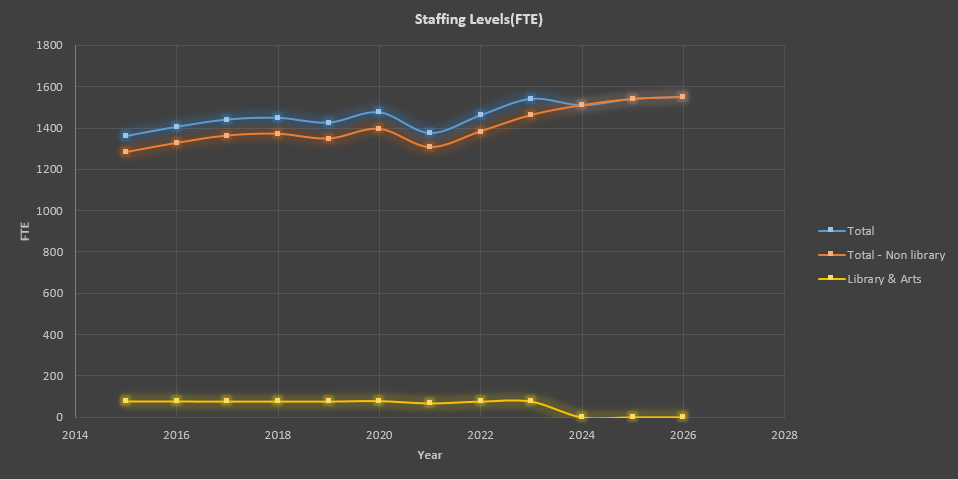
Graph 1 – Staffing Levels (FTE)
| Department | 2015 | 2016 | 2017 | 2018 | 2019 | 2020 | 2021 | 2022 | 2023 | 2024 | 2025 | 2026 |
|---|---|---|---|---|---|---|---|---|---|---|---|---|
| City Attorney’s Office | 25.7 | 25.7 | 27.7 | 27.7 | 28.0 | 28.0 | 27.0 | 24.0 | 25.0 | 26.0 | 27.0 | 27.0 |
| City Clerk’s Office | 3.0 | 3.0 | 4.0 | 4.0 | 4.0 | 4.0 | 4.0 | |||||
| City Council | 0.0 | 0.0 | 0.0 | 0.0 | 1.0 | 1.0 | 1.0 | 1.0 | 1.0 | 1.0 | 1.0 | 10.0 |
| City Manager’s Office | 18.5 | 13.0 | 15.9 | 18.9 | 14.0 | 15.0 | 9.0 | 17.7 | 18.7 | 19.7 | 25.8 | 26.8 |
| Climate Initiatives | 21.0 | 18.0 | 19.0 | 18.0 | 20.0 | 22.0 | 22.0 | |||||
| Communication | 8.5 | 12.8 | 13.5 | 14.8 | 15.3 | 16.3 | 17.8 | 20.5 | 29.3 | 29.4 | 33.0 | 33.5 |
| Community Vitality | 46.5 | 46.5 | 49.0 | 48.3 | 47.2 | 48.0 | 40.9 | 41.9 | 44.1 | 46.3 | 47.3 | 35.3 |
| Facilities&Fleet | 33.4 | 35.5 | 36.3 | 32.5 | 34.2 | 36.3 | 37.5 | 42.2 | 46.2 | 52.9 | 51.9 | 52.9 |
| Finance | 38.7 | 44.5 | 47.6 | 48.1 | 44.0 | 47.0 | 42.0 | 45.0 | 49.0 | 48.2 | 50.9 | 50.9 |
| Fire-Rescue | 121.3 | 124.3 | 124.0 | 124.0 | 123.0 | 124.0 | 122.0 | 133.0 | 138.0 | 142.0 | 142.0 | 140.0 |
| Human Resources | 24.6 | 24.4 | 23.4 | 23.4 | 23.0 | 23.0 | 22.0 | 24.0 | 32.0 | 27.0 | 28.0 | 28.0 |
| Housing&Human Services | 37.2 | 37.2 | 36.2 | 36.2 | 48.6 | 48.8 | 44.3 | 49.1 | 61.3 | 66.0 | 66.8 | 64.8 |
| Information Technology | 37.2 | 40.3 | 40.8 | 39.8 | 41.8 | 44.0 | 39.0 | 46.5 | 51.9 | 57.2 | 61.2 | 61.5 |
| Library & Arts | 78.5 | 78.5 | 77.5 | 77.5 | 77.8 | 80.3 | 68.8 | 77.8 | 77.8 | |||
| Municipal Court | 21.1 | 21.1 | 20.4 | 19.4 | 18.4 | 18.4 | 16.4 | 16.4 | 18.4 | 18.4 | 18.4 | 16.4 |
| Open Space & Mountain Parks | 102.4 | 117.2 | 128.4 | 125.4 | 121.6 | 125.4 | 126.4 | 127.4 | 136.5 | 145.6 | 147.6 | 142.6 |
| Parks & Recreation | 130.4 | 136.4 | 139.1 | 146.4 | 141.5 | 145.3 | 125.8 | 134.0 | 142.8 | 151.5 | 153.3 | 151.6 |
| Planning, Housing & Sustainability | 109.6 | 115.4 | 122.6 | 129.3 | 111.6 | 111.5 | 88.4 | 92.4 | 96.7 | 97.7 | 98.7 | 122.7 |
| Police | 288.0 | 290.9 | 291.9 | 291.8 | 288.3 | 289.3 | 280.6 | 288.9 | 285.5 | 282.0 | 284.5 | 280.5 |
| Transportation | 70.3 | 71.4 | 73.6 | 69.0 | 69.2 | 75.2 | 77.0 | 81.5 | 91.9 | 97.6 | 98.9 | 91.4 |
| Utilities | 166.9 | 168.0 | 168.9 | 172.7 | 173.8 | 173.9 | 168.2 | 178.6 | 176.0 | 180.9 | 181.1 | 190.6 |
| Total | 1361.8 | 1405.9 | 1440.5 | 1448.9 | 1426.1 | 1475.4 | 1375.8 | 1460.7 | 1539.6 | 1509.1 | 1539.1 | 1548.3 |
Table 1 – Staffing Levels (FTE) by Department 2015-2026
Source:
Staffing Changes
From 2019 to 2025 some departments experienced significant changes.
- Two departments effectively ceased to exist over this period:
- The City Clerk’s Office was folded into the City Manager’s Office
- Library & Arts was spun off into a Library district.
- Planning, Housing & Sustainability shows a -12% change as a result of moving code enforcement to the Police department.
- Communications grew 116% over that period.
The increase in staff size seen between 2019 and 2025 has the knock-on effect that support services also have to grow to service the additional FTEs. Table 2 shows the changes to staff size for each department. The 4 fastest growing departments are providing primarily internal support to themselves and public facing departments.
Resources required to support a growing workforce are not limited to additional FTEs but also includes employment benefits such as health insurance, pensions, real estate required to house the additional FTEs and Information Technology to provide digital support.
| Department | Change (%) | Change (FTE) | Service Type |
|---|---|---|---|
| Library & Arts | -100% | -77.8 | Public |
| City Clerk’s Office | -100% | -4.0 | Public |
| Planning, Housing & Sustainability | -12% | -12.9 | Public |
| City Attorney’s Office | -4% | -1.0 | Public |
| Police | -1% | -3.8 | Public |
| Municipal Court | 0% | 0.0 | Public |
| City Council | 0% | 0.0 | Public |
| Community Vitality | 0% | 0.0 | Public |
| Utilities | 4% | 7.3 | Public |
| Parks & Recreation | 8% | 11.8 | Public |
| Fire-Rescue | 15% | 19.0 | Public |
| Finance | 16% | 6.9 | Internal |
| Open Space & Mountain Parks | 21% | 26.0 | Public |
| Human Resources | 22% | 5.0 | Internal |
| Housing & Human Services | 37% | 18.2 | Public |
| Transportation | 43% | 29.7 | Public |
| Information Technology | 47% | 19.5 | Internal |
| Facilities & Fleet | 52% | 17.7 | Internal |
| City Manager’s Office | 84% | 11.8 | Internal |
| Communication | 116% | 17.8 | Internal |
Table 2 – Staffing Changes from 2019 to 2025
2026 shows little growth among departments except for:
- In 2024 Ballot item 2C passed, which increases City Council pay to 40% of AMI. This accounts for the +9 FTE in City Council numbers
- The big change is moving 24 FTE to Planning, Housing & Sustainability (PHS)
- Community Vitality transfers parking enforcement to PHS.
- Police transfer code enforcement positions to PHS.
| Department | Change (%) | Change (FTE) | Service Type |
|---|---|---|---|
| Community Vitality | -25% | -12.0 | Public |
| Municipal Court | -11% | -2.0 | Public |
| Transportation | -8% | -7.4 | Public |
| Open Space & Mountain Parks | -3% | -5.0 | Public |
| Housing & Human Services | -3% | -2.0 | Public |
| Fire-Rescue | -1% | -2.0 | Public |
| Police | -1% | -4.0 | Public |
| Parks & Recreation | -1% | -1.6 | Public |
| Human Resources | 0% | 0.0 | Internal |
| Finance | 0% | 0.0 | Internal |
| Climate Initiatives | 0% | 0.0 | Internal |
| City Attorney’s Office | 0% | 0.0 | Public |
| Information Technology | 0% | 0.3 | Internal |
| Communication | 2% | 0.5 | Internal |
| Facilities & Fleet | 2% | 1.0 | Internal |
| City Manager’s Office | 4% | 1.0 | Internal |
| Utilities | 5% | 9.5 | Public |
| Planning, Housing & Sustainability | 24% | 24.0 | Public |
| City Council | 900% | 9.0 | Public |
Table 3 – Staffing Changes from 2025 to 2026
Source:
Staffing Costs
The costs of increasing staff size over the last 6 years as well as changes proposed for the 2026 budget can be seen in the Combined Budget Summary shown in Graph 2 and Table 4. This summary aggregates the costs of personnel, internal services, operating expenses, debt service and capital projects.
What this data shows is:
- From 2019 to 2025 the cost of personnel rose from $149M to $205M or 37%.
- The cost of internal services increased from $17M in 2019 to $62M in 2025 or 264%.
- For 2026 the amount devoted to capital projects will be sharply lower than the previous 3 years.
- In the face of no staff reductions, the capital budget is absorbing all of the cuts, mainly for Facilities & Fleet.
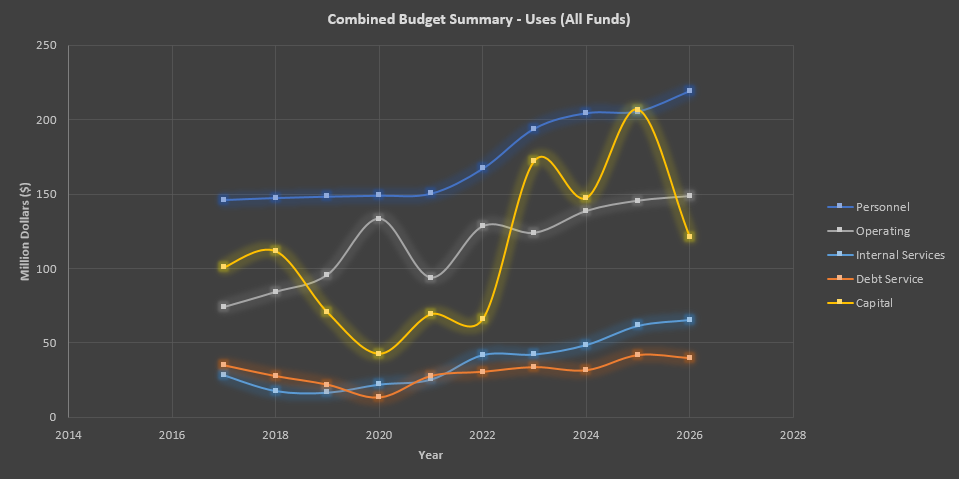
Graph 2 – Combined Budget Summary
| Combined Budget Summary | 2017 | 2018 | 2019 | 2020 | 2021 | 2022 | 2023 | 2024 | 2025 | 2026 |
|---|---|---|---|---|---|---|---|---|---|---|
| Personnel | $146M | $148M | $149M | $149M | $151M | $167M | $194M | $204M | $205M | $219M |
| Operating | $74M | $84M | $96M | $133M | $94M | $128M | $124M | $139M | $145M | $148M |
| Internal Services | $28M | $18M | $17M | $22M | $26M | $42M | $42M | $49M | $62M | $66M |
| Debt Service | $35M | $28M | $22M | $13M | $28M | $31M | $34M | $32M | $42M | $40M |
| Capital | $101M | $112M | $71M | $43M | $69M | $66M | $173M | $147M | $207M | $121M |
| Total | $385M | $389M | $354M | $361M | $367M | $434M | $567M | $571M | $661M | $594M |
Table 4 – Combined Budget Summary 2017-2026
Source:
Peer Cities
When looking at the performance of an institution it is useful to compare them to their peers.
The comparative metric for Table 5 is FTEs per 100,000 residents of a city.
In this group Boulder is in the top 5 for most FTE per resident.
| City | FTE/100,000 | FTE | Population |
|---|---|---|---|
| Ann Arbor | 728 | 849 | 116600 |
| Durham | 791 | 2404 | 304000 |
| College Station | 818 | 1047.5 | 128100 |
| Madison | 837 | 2375.85 | 283700 |
| Iowa City | 853 | 649.7 | 76200 |
| Provo | 859 | 963.8 | 112200 |
| Mountain View | 875 | 709.5 | 81100 |
| Eugene | 945 | 1683.5 | 178200 |
| Gainesville | 986 | 1461.75 | 148200 |
| New Haven | 1031 | 1433 | 139000 |
| Fort Collins | 1149 | 1960.65 | 170600 |
| Tempe | 1159 | 2235.4 | 192800 |
| Chapel Hill | 1197 | 783.74 | 65500 |
| Evanston | 1222 | 894.46 | 73200 |
| Santa Barbara | 1280 | 1088.15 | 85000 |
| Huntsville | 1407 | 3261 | 231700 |
| Rochester | 1442 | 2955 | 204900 |
| Boulder | 1474 | 1539.1 | 104400 |
| Berkeley | 1513 | 1747 | 115500 |
| Cambridge | 1552 | 1834 | 118200 |
| Syracuse | 1654 | 2395 | 144800 |
| Pasadena | 1847 | 2406.88 | 130300 |
Table 5 – Staffing Levels Among Peer Cities
Source:
- FTE Data: 2025 budget documents downloaded from the peer cities
- Population Data: https://worldpopulationreview.com/